
If you collect feedback, you sometimes need to know exactly what it is. On the one hand, you probably want to be able to analyse the result at a specific point in time and on the other hand, this is very interesting over a certain period of time. Both analyses provide valuable impulses for your work and your events. That's why you can use TEDME to determine the Net Promoter Score for a single event, session or survey as well as over a longer period of time. Curious? Then read on.
The Net Promoter Score
The Net Promoter Score, or NPS for short, is a Key Performance Indicator, or KPI for short, that tells you more about your company's customer satisfaction and customer loyalty. A standardised value is calculated to determine the NPS. The question of your customer's willingness to recommend your company to others is at the centre of all NPS determinations.
After all, satisfied and loyal customers are very valuable, as it is much cheaper for most companies to maintain existing customers and keep them as satisfied customers than to acquire new customers.
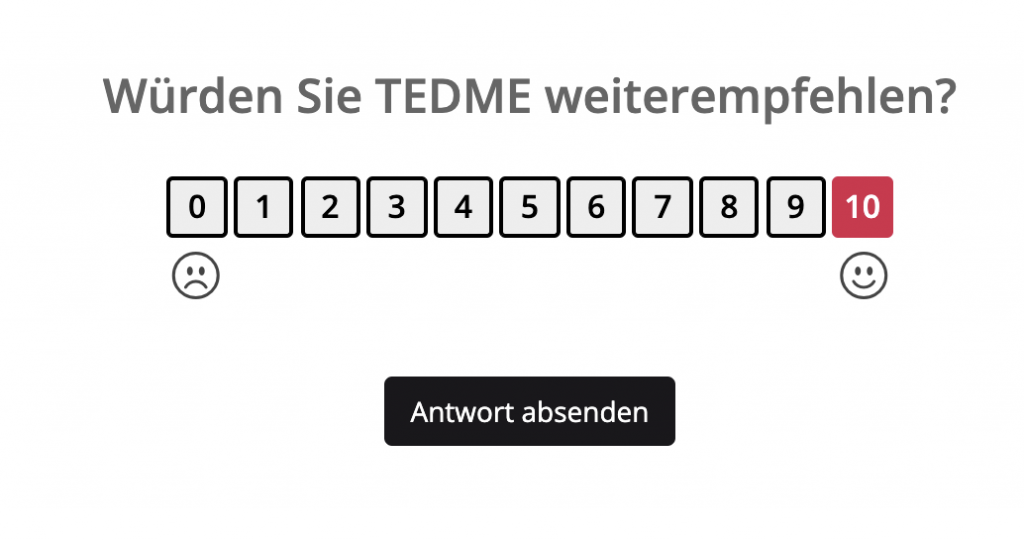
The answers to the Net Promoter Score are measured on a scale from zero, which the respondent rates as "very unlikely", to 10, which they rate as "very likely". This standardisation in the response options is what makes the Net Promoter Score so popular - both in marketing and at events.
Respondents are divided into three categories or customer types based on their answers:
- Promoters - these are the supporters,
- Detractors - these are the critics
- and indifferents - these are passives.
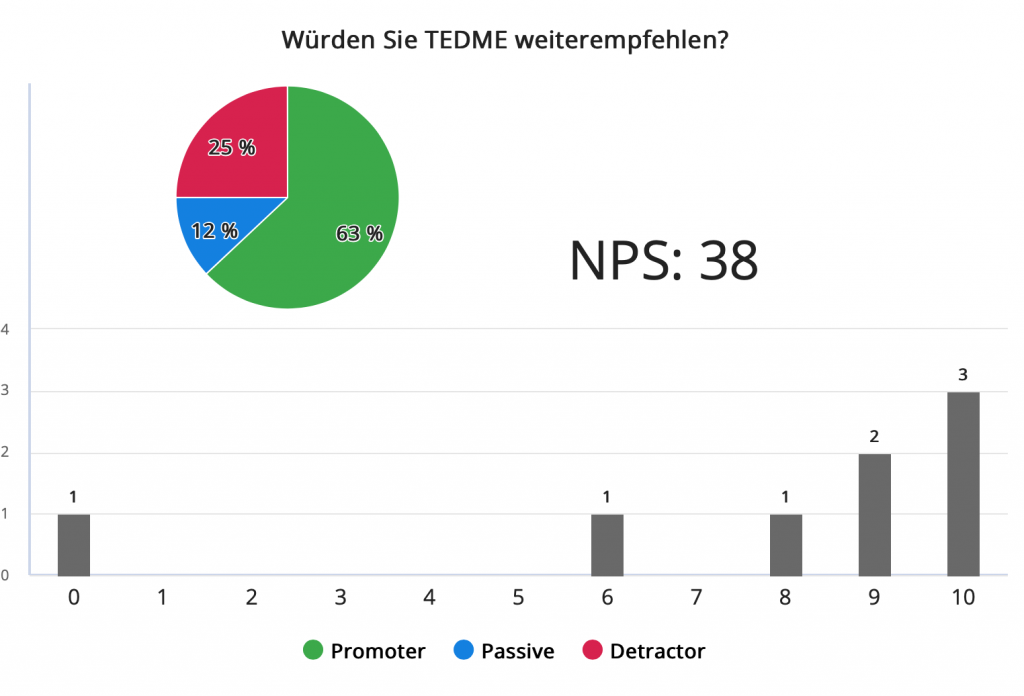
Promoters are those customers who responded with a 10 or 9 and are very enthusiastic. Customers who answered 8 or 7 are considered passive and those who answered zero to six are critics.

The Net Promoter Score as a snapshot
With TEDME you can calculate the Net Promoter Score for each individual moment. For example, as part of a single event.
With this question, you can find out how high the proportion of your promoters, detractors and indifferents is at any given time. This is how the net promoter score is realised with TEDME:
The Net Promoter Score over time
It is also helpful to look at and analyse the development of the Net Promoter Score over a certain period of time.
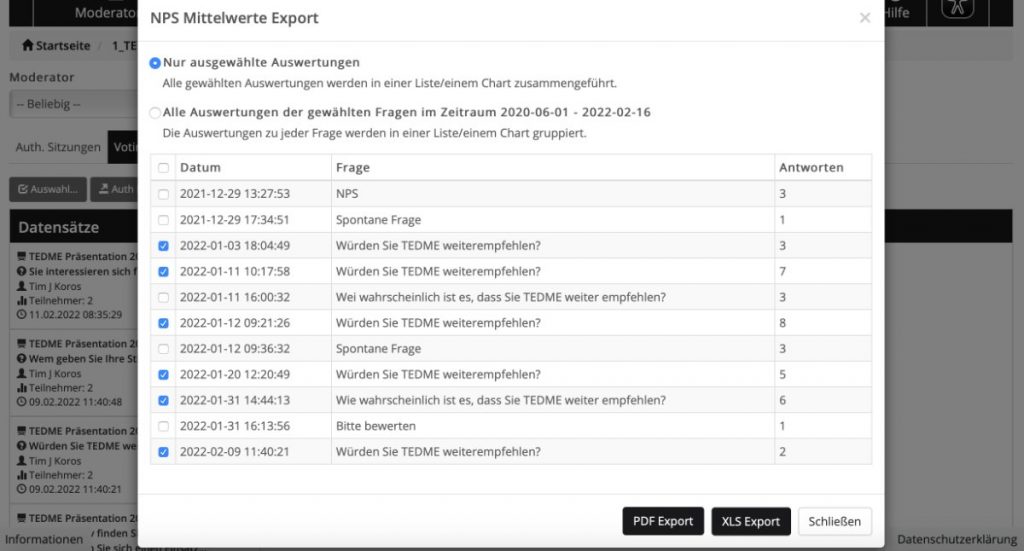
With TEDME you can display the NPS over time as well as the average value over the previously selected period.
You can choose very precisely which questions and which points in time you want to see in the NPS analysis:
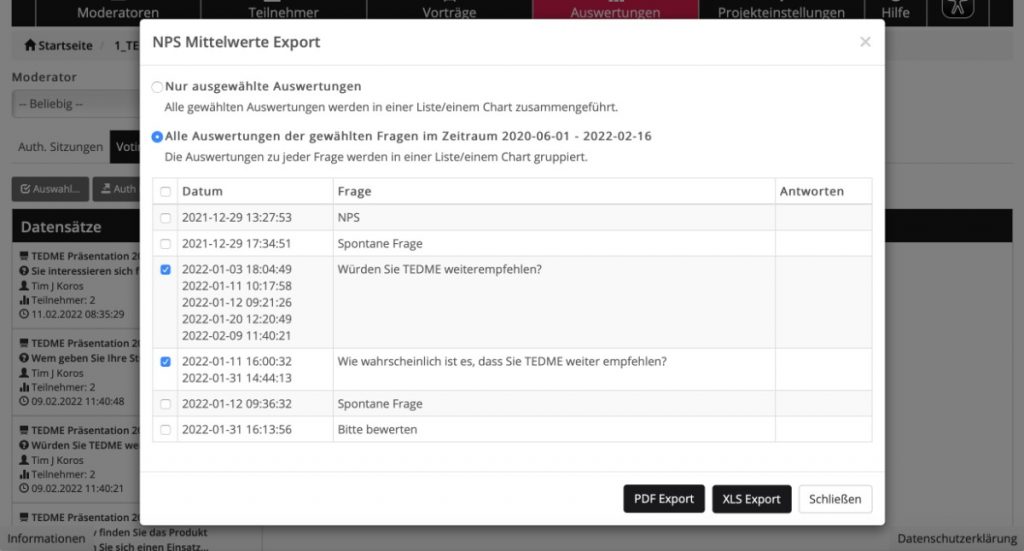
Or you can enter a specific time period for which you want to see the NPS:
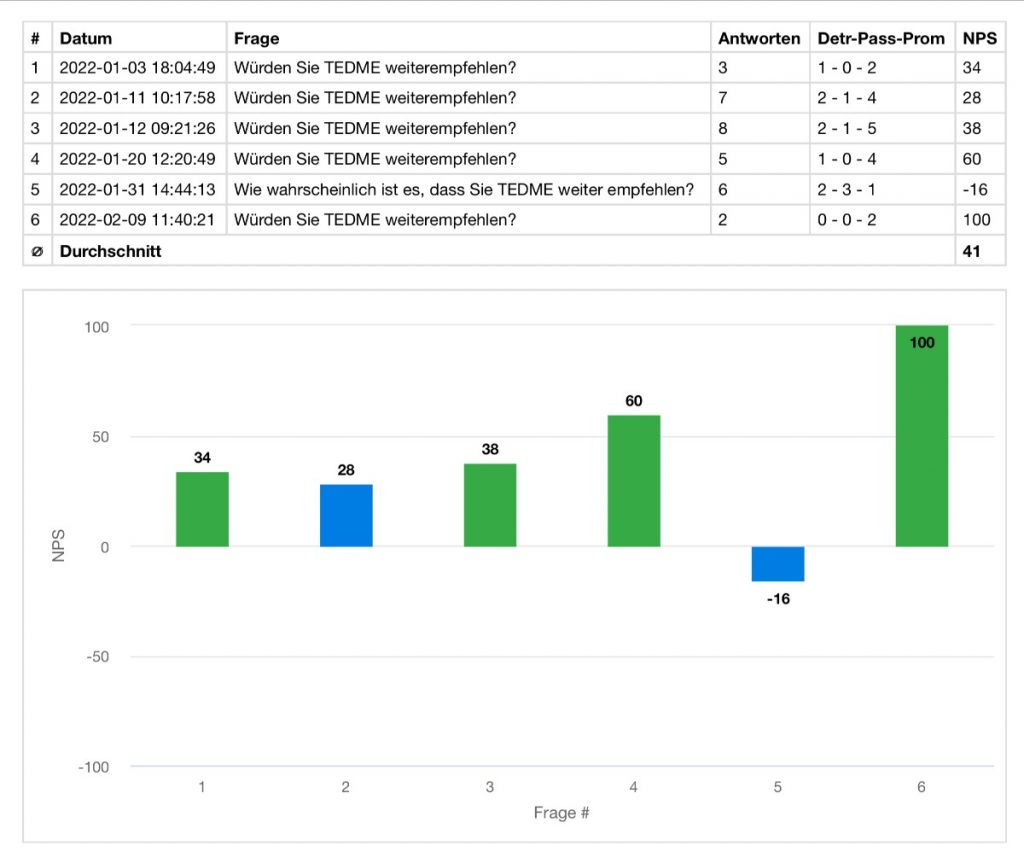
Here you can see the NPS for 2 questions. There is a single NPS for each point in time and you can display an average NPS for all analysed questions and dates. In this case: 41.
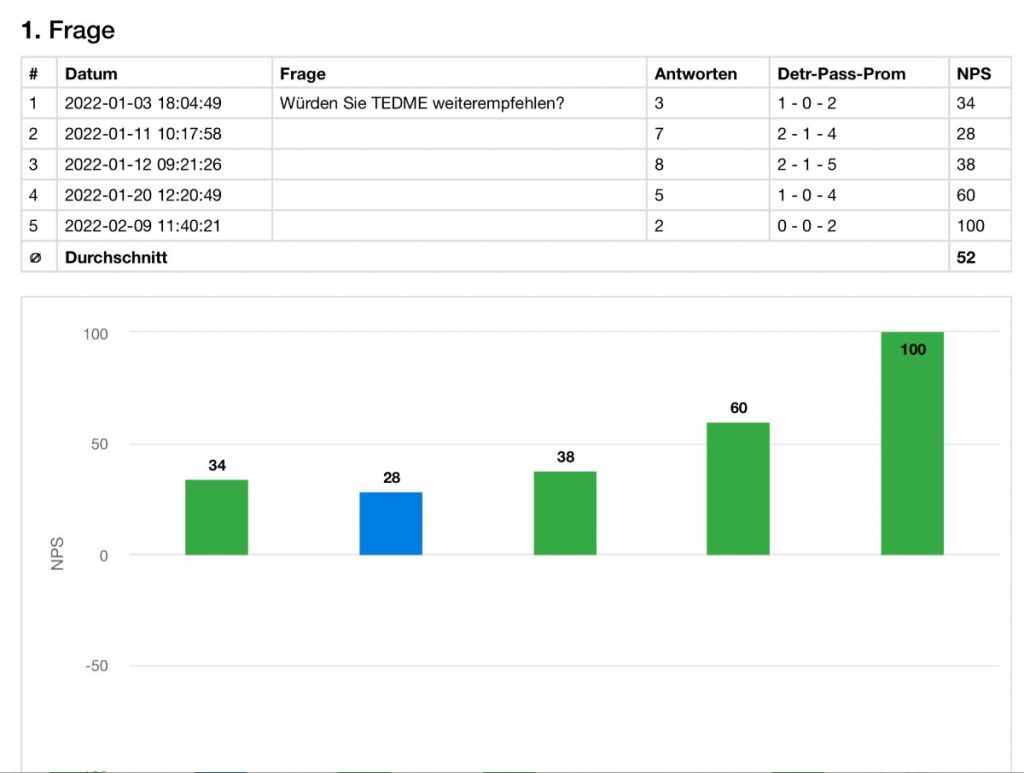
Or you can display only the results for the question "Would you recommend TEDME?". Here is the average of all NPS determined: 52.
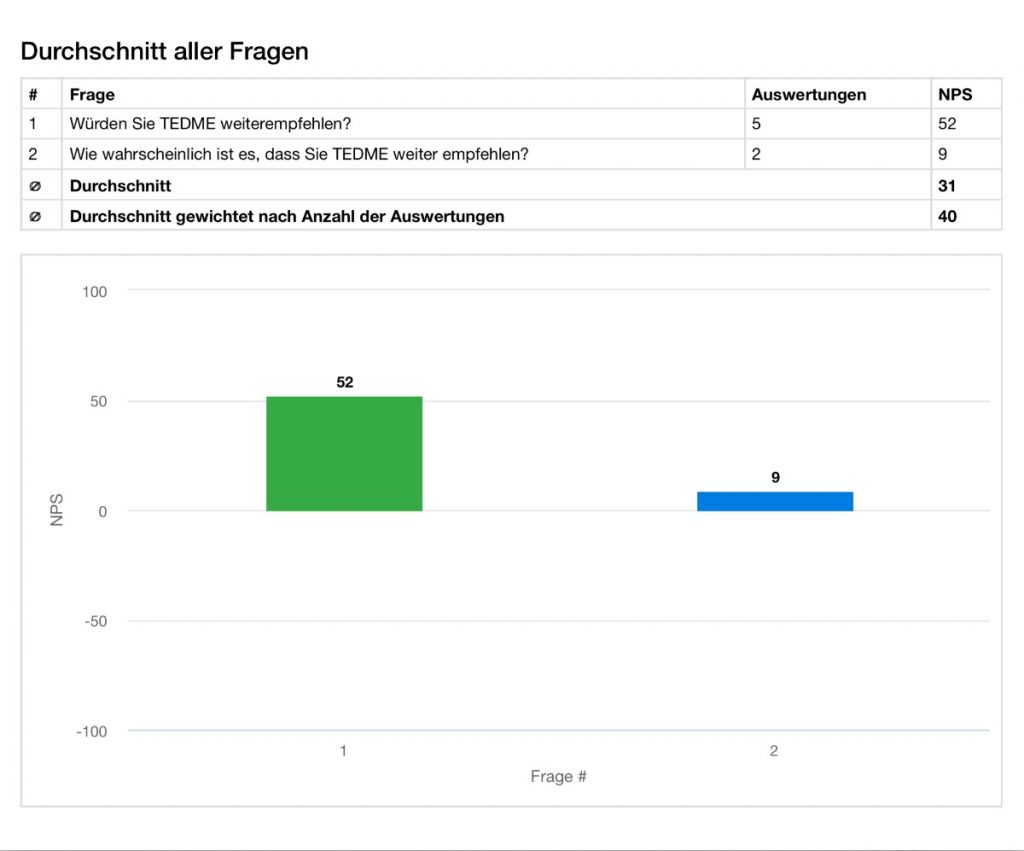
You can also have both questions analysed against each other. On the one hand, you can display a simple average of both questions: 31.
Alternatively, weight question one more heavily, as 5 analyses are available here instead of just 2 analyses for question two. This will give you a weighted NPS of 40.
Conclusion
The Net Promoter Score is a key indicator that shows you how strongly your customers would recommend your offers, services or your company to others. With TEDME, you can easily determine this key figure and visualise it both at a specific point in time and its development over a longer period of time.
Do you have questions about the Net Promoter Score with TEDME? Then get in touch with us today.